
How To : Read the Vedic astrology chart
This Video will explain how to read the Vedic astrology chart.

This Video will explain how to read the Vedic astrology chart.
New to Microsoft Excel? Looking for a tip? How about a tip so mind-blowingly useful as to qualify as a magic trick? You're in luck. In this MS Excel tutorial from ExcelIsFun, the 647th installment in their series of digital spreadsheet magic tricks, you'll learn how to create ...more
It's certain that the release of Apple's ARKit is going to be game changing for businesses. This demo video was created by YouTube user hdsenevi who used the ARKit to create a simple bar chart. The chart has adjustable settings, allowing the user to make each bar larger or sm ...more
Whether you're interested in learning Microsoft Excel from the bottom up or just looking to pick up a few tips and tricks, you've come to the right place. In this tutorial from everyone's favorite digital spreadsheet guru, ExcelIsFun, the nth installment in his "Highline Excel ...more
In this screencast tutorial, Steve shows you how to quickly and simply create a bar chart, from the data you have entered into your worksheet in Open Office Calc. If you're looking for a simple and clear way to represent your statistical data, then a simple bar chart is an opt ...more
New to Microsoft Excel? Looking for a tip? How about a tip so mind-blowingly useful as to qualify as a magic trick? You're in luck. In this MS Excel tutorial from ExcelIsFun, the 636th installment in their series of digital spreadsheet magic tricks, you'll learn how to create ...more
This is an informative video tutorial on how to search graphics, tables and charts using MS Word 2010. The author informs that the earlier MS Word editions had fast and easy search options, but the same feature built into the 2010 edition is vastly improved. One simply has to ...more
Super Ventures has published "The AR Landscape," a chart encompassing the major players and startups that are shaping augmented reality. Launched in February as the first incubator and fund focused on augmented reality, Super Ventures outlines companies working augmented reali ...more
You can use Keynote to create animated charts and graphs. Then you can export them to use in iMovie and other software to make video presentations. It's easy! So easy, in fact, that this home-computing how-to from MacMost can present a full overview of the process in about fiv ...more
New to Microsoft Excel? Looking for a tip? How about a tip so mind-blowingly useful as to qualify as a magic trick? You're in luck. In this MS Excel tutorial from ExcelIsFun, the 204th installment in their series of digital spreadsheet magic tricks, you'll learn how to add a m ...more
In this video the instructor shows how to create charts and graphs in Microsoft Word. First, open the Word document and select an area to insert the charts. Now go to the Insert tab in the ribbon and select the Chart icon. The Insert Chart window opens up with various chart te ...more
New to Microsoft Excel? Looking for a tip? How about a tip so mind-blowingly useful as to qualify as a magic trick? You're in luck. In this MS Excel tutorial from ExcelIsFun, the 239th installment in their series of digital spreadsheet magic tricks, you'll learn how to create ...more
Looking for a guide on how to set up charts within FileMaker Pro 11? Look no further. Whether you're new to the FileMaker Pro database management program or just want to learn how to take advantage of FileMaker Pro 11's new features, you're sure to benefit from this free video ...more
New to Microsoft Excel? Looking for a tip? How about a tip so mind-blowingly useful as to qualify as a magic trick? You're in luck. In this MS Excel tutorial from ExcelIsFun, the 92nd installment in their series of digital spreadsheet magic tricks, you'll learn how to add data ...more
This video introduces how to use Excel to sort data, perform the Frequency function, and present data in line chart. See how to apply condition formatting when working in Microsoft Excel 2007. Whether you're new to Microsoft's popular word processing application application or ...more
In this video tutorial, you'll learn how to generate and customize the look of simple charts within the iWork '09-version of Numbers. For all the details, including step-by-step instructions, and to get started creating your own charts, take a look.
There are times when you need to make a super-quick pie chart (such as to insert in a blog post or quick printout) but find that doing it in Excel or OpenOffice takes a bit more effort than you’d like. Is there a faster way for quick’n'dirty pie charts? Yes. You can use Create ...more
New to Microsoft Excel? Looking for a tip? How about a tip so mind-blowingly useful as to qualify as a magic trick? You're in luck. In this MS Excel tutorial from ExcelIsFun, the 637th installment in their series of digital spreadsheet magic tricks, you'll learn how to create ...more
Adding a visual indicator to an Excel Gantt chart of how far into the project you are.
This video demonstrates how to create a graph or chart in Excel 2007. From the people who brought you the Dummies instructional book series, brings you the same non-intimidating guides in video form. Watch this video tutorial to learn how to create a graph or chart in Excel 20 ...more
This video demonstrates how to create pivot chart in Excel 2007. From the people who brought you the Dummies instructional book series, brings you the same non-intimidating guides in video form. Watch this video tutorial to learn how to create pivot chart in Excel 2007, For Du ...more
This is a short archery video that attempts to explain why arrow application charts are so complicated. The first three minutes or so present a model of a shaft to help visualize the independent factors that drive each section of the chart.
As you might guess, one of the domains in which Microsoft Excel really excels is finance math. Brush up on the stuff for your next or current job with this how-to. In this tutorial from everyone's favorite digital spreadsheet guru, YouTube's ExcelIsFun, the 64th installment in ...more
When you are solving inequality for a rational function you don't do it the same way as you would solve an equality. Now the instructor shows how to solve an inequality with the help of an example. Now to solve an inequality which is in the form a/b first take the numerator an ...more
New to Microsoft Excel? Looking for a tip? How about a tip so mind-blowingly useful as to qualify as a magic trick? You're in luck. In this MS Excel tutorial from ExcelIsFun, the 2nd installment in their series of digital spreadsheet magic tricks, you'll learn how to create ch ...more
New to Microsoft Excel? Looking for a tip? How about a tip so mind-blowingly useful as to qualify as a magic trick? You're in luck. In this MS Excel tutorial from ExcelIsFun, the 258th installment in their series of digital spreadsheet magic tricks, you'll learn how to make ch ...more
In this online guide to astrological signs, our long-time astrologer, astrological consultant and metaphysical bookshop owner will tell you everything you need to know about this ancient belief system. Part 1 of 16 - How to Read the symbols, charts & houses in astrology. Read ...more
New to Microsoft Excel? Looking for a tip? How about a tip so mind-blowingly useful as to qualify as a magic trick? You're in luck. In this MS Excel tutorial from ExcelIsFun, the 93rd installment in their series of digital spreadsheet magic tricks, you'll learn how to use cond ...more
Take a look at this instructional video and learn how to use a Microsoft Office Excel worksheet that contains employee data to create shapes, connect them according to your organization's structure, and add data to each shape in your drawing automatically.
Xtracharts, a control for Winforms, allows the user to easily export charts made using the program into a PDF, HTML or MHT, Excel spreadsheet or standard image. This tutorial shows the Winforms user how to properly code and then export the chart.
Apple released the fourth public beta for iPhone today, Monday, Mar. 15. The update (build number 18E5178a) comes three hours after the fourth 14.5 developer beta, and includes references in its code to a new "City Charts" playlist feature in Apple Music. This new playlist fe ...more
In this clip, we learn how to employ chord charts when playing the uke. Thinking about learning the ukulele? Well, you're in luck, as, thanks to WonderHowTo's ever-growing library of free video ukulele lessons, it's never been easier. For more information, including detailed, ...more
It's no secret that MoviePass is a shell of the service it once was. The primary $9.95/month plan for three movies each month is inconsistent and can change drastically depending on your location. Thankfully, MoviePass isn't the only movie ticket subscription service available ...more
This video demonstrates how to add a data table to an Excel 2007 chart. From the people who brought you the Dummies instructional book series, brings you the same non-intimidating guides in video form. Watch this video tutorial to learn how to add a data table to an Excel 2007 ...more
If you are an active player of Pokémon GO, you may soon be capturing more than just virtual pocket monsters. When it comes to mapping the world, Niantic does not have the fleet of mapping cars that its former parent company, Google, has at its disposal. But it does have a com ...more
Whether you're interested in learning Microsoft Excel from the bottom up or just looking to pick up a few tips and tricks, you're in the right place. In this tutorial from everyone's favorite digital spreadsheet guru, ExcelIsFun, the 5th installment in his "Highline Excel Clas ...more
You didn't have to attend this year's CES to have gadget envy. There are so many great smartphones, computers, laptops, and other gadgets available in the market that the real challenge becomes choosing the right one to fit your needs and your budget. While sites like Amazon ...more
If you're looking to get pregnant, there's a lot of information you should know, especially if you're having a hard time conceiving. One of the things you should know is what your basal body temperature is. This can help you and your doctor figure out about your ovulation. Mic ...more
I can't argue with this. Source: Geekcentricity
Learn how to compare numerical figures and create a simple bar chart in Microsoft Excel.
From Ramanujan to calculus co-creator Gottfried Leibniz, many of the world's best and brightest mathematical minds have belonged to autodidacts. And, thanks to the Internet, it's easier than ever to follow in their footsteps (or just study for that next big test). With this in ...more
In almost all charts and forms of sheet music, the composer will more than likely have added rhythmic dictation to the staff, a specific rhythm that he wants you to play over the progression using the chord. In this video you will get a breakdown of basic rhythmic dictation of ...more
Ever wanted to make a pie chart in Xara Xtreme? This video will help guide you through the process of using Zara Xtreme to cut a circle into a pie chart segments using percentages as angles. After finding the center of the circle using a line and the central alignment tool, yo ...more
Check out this tutorial and learn how to create chars in Excel 2007. In Office Excel 2007, you just select data in your worksheet, choose a chart type that best suits your purpose, and click. Want to try a different chart type? Just click again and select a new chart type from ...more
New to Microsoft Excel? Looking for a tip? How about a tip so mind-blowingly useful as to qualify as a magic trick? You're in luck. In this MS Excel tutorial from ExcelIsFun and Mr. Excel, the 4th installment in their joint series of digital spreadsheet magic tricks, you'll le ...more
Charts can be used to visually present your data. In this tutorial we will take a look at how to create basic column and pie charts using MS Excel. Learn it to create a sales chart for your boss! Creat charts in Excel. Click through to watch this video on vtutorial.com
In this Excel basics video, the instructor talks about the basics of charts. There is an enormous difference in how you make charts between Microsoft Excel 2003 and 2007. In both the versions, to make charts the first thing you do is highlight the data cells in your workspace. ...more
From Ramanujan to calculus co-creator Gottfried Leibniz, many of the world's best and brightest mathematical minds have belonged to autodidacts. And, thanks to the Internet, it's easier than ever to follow in their footsteps (or just study for that next big test). With this in ...more
New to Microsoft Excel? Looking for a tip? How about a tip so mind-blowingly useful as to qualify as a magic trick? You're in luck. In this MS Excel tutorial from ExcelIsFun, the 351st installment in their series of digital spreadsheet magic tricks, you'll learn how to create ...more
It's often best to use a graphical representation of the data you've assembled or calculated. This tutorial shows you how to create charts to visually show your results.
Smartphones are inherently bad for privacy. You've basically got a tracking device in your pocket, pinging off cell towers and locking onto GPS satellites. All the while, tracking cookies, advertising IDs, and usage stats follow you around the internet. So no, there's no such ...more
The headline above may have some spice addicts shaking their heads, but, believe it or not, there are people out there who either don't like or can't handle a ton of spice. And even heat lovers sometimes add more spice to a recipe than intended—so check out these handy method ...more
It seems like every day now that we see a new headline on a cyber security breach. These headlines usually involve millions of records being stolen from some large financial institution or retailer. What doesn't reach the headlines are the many individual breaches that happen ...more
Welcome back, my budding hackers. So many of you are interested in hacking Wi-Fi that I have decided to revisit my Wi-Fi Hacking series with some updated and more in-depth material. I strongly suggest that you look at some of my earlier posts, such as "Getting Started with Te ...more
According to a study done by Kaspersky, 7.6% of Android users root their phones. That may not sound like a lot, but with over 2 billion Android devices out there, the math works out to over 150 million rooted phones — more than the total population of Russia, Mexico, or Japan ...more
While music may not technically be a "universe language," it is the one language listened to by all. There are over 1,500 music genres today—rap, classical, rock, jazz, trap, hip-hop, house, new wave, vaperwave, charred death, nintendocore... and the list goes on. And if you'r ...more
A burner number isn't just for criminals and cheating spouses. In this digital world, with many of our interactions being conducted online, a throwaway phone number acts as a buffer — it lets you enjoy the web without having to give out your personal information, such as real ...more
Your smartphone stays with you everywhere you go, so it's only a matter of time before you spill coffee all over it or drop it on the ground. For some of you, it has already happened, perhaps even multiple times. That's why we thought it was important to find out which flagshi ...more
Streaming movies and TV shows on phones is more popular today than ever, but what about when you're on a plane, have a limited data plan, or will be in a no-service area? You'll want to download your movies and TV shows instead. While Netflix is excellent, you can't rent or do ...more
Whether you have or are getting an iPhone 12, 12 mini, 12 Pro, or 12 Pro Max, the default way to check the current battery life is via the tiny battery icon in the top right of the status bar. But that does not accurately depict how much juice is left, not as a specific percen ...more
 How To:
Apple's Making Your iPhone's Reminders App Even Better with 10 New Features
How To:
Apple's Making Your iPhone's Reminders App Even Better with 10 New Features
 How To:
Tired of Tapping? Use an External Keyboard on Your iPhone and Unlock Tons of Keyboard Shortcuts
How To:
Tired of Tapping? Use an External Keyboard on Your iPhone and Unlock Tons of Keyboard Shortcuts
 How To:
iOS 18 Upgrades Your iPhone's Buttons with Eye-Catching Visual Effects
How To:
iOS 18 Upgrades Your iPhone's Buttons with Eye-Catching Visual Effects
 How To:
Get RCS Messaging in Your iPhone's Messages App for iMessage-Like Chats with Android Users
How To:
Get RCS Messaging in Your iPhone's Messages App for iMessage-Like Chats with Android Users
 How To:
10 Things Everyone Should Know About the iPhone's Keyboard for a Better Typing Experience
How To:
10 Things Everyone Should Know About the iPhone's Keyboard for a Better Typing Experience
 How To:
Add More Domain Extensions to Your iPhone's Keyboard Shortcut to Type Email Addresses or Website URLs Faster
How To:
Add More Domain Extensions to Your iPhone's Keyboard Shortcut to Type Email Addresses or Website URLs Faster
 How To:
Apple's Massive Calculator Update Lets You Convert Currency, Area, Length, Time, and Other Measurement Units with Ease
How To:
Apple's Massive Calculator Update Lets You Convert Currency, Area, Length, Time, and Other Measurement Units with Ease
 How To:
Get Instant Solutions to Mathematical Problems on Your iPhone or iPad with Apple's New Math Notes
How To:
Get Instant Solutions to Mathematical Problems on Your iPhone or iPad with Apple's New Math Notes
 How To:
Remove or Add 'Where from' Metadata in Files on macOS
How To:
Remove or Add 'Where from' Metadata in Files on macOS
 How To:
Download Apple's New iOS 18 and iPadOS 18 Wallpapers to Use on Any Device
How To:
Download Apple's New iOS 18 and iPadOS 18 Wallpapers to Use on Any Device
 How To:
AirPods Are Getting Even Better Thanks to iOS 18
How To:
AirPods Are Getting Even Better Thanks to iOS 18
 How To:
Download and Install iOS 17.6 Beta on Your iPhone — And Try New Features Before Everyone Else
How To:
Download and Install iOS 17.6 Beta on Your iPhone — And Try New Features Before Everyone Else
 How To:
Download and Install iPadOS 17.6 Beta on Your iPhone to Explore New Features Before Everyone Else
How To:
Download and Install iPadOS 17.6 Beta on Your iPhone to Explore New Features Before Everyone Else
 How To:
Lock and Hide Apps on Your iPhone or iPad — The Official Way
How To:
Lock and Hide Apps on Your iPhone or iPad — The Official Way
 How To:
10 New Home Screen Features Coming to iPhone with iOS 18
How To:
10 New Home Screen Features Coming to iPhone with iOS 18
 How To:
Your iPhone's Flashlight Has New Focus Beams and Greater Brightness Control on iOS 18
How To:
Your iPhone's Flashlight Has New Focus Beams and Greater Brightness Control on iOS 18
 How To:
Your iPhone's Clock App Is Getting a Big New Feature with iOS 18
How To:
Your iPhone's Clock App Is Getting a Big New Feature with iOS 18
 How To:
iOS 18 Lets You Change Widget Sizes on Your iPhone's Home Screen Without Deleting Them First
How To:
iOS 18 Lets You Change Widget Sizes on Your iPhone's Home Screen Without Deleting Them First
 How To:
With iOS 18, You Can Finally Hide App, Folder, and Widget Names on Your iPhone's Home Screen
How To:
With iOS 18, You Can Finally Hide App, Folder, and Widget Names on Your iPhone's Home Screen
 How To:
Download and Install iOS 18 Beta or iPadOS 18 Beta to Try New iPhone or iPad Features First
How To:
Apple's Making Your iPhone's Reminders App Even Better with 10 New Features
How To:
Download and Install iOS 18 Beta or iPadOS 18 Beta to Try New iPhone or iPad Features First
How To:
Apple's Making Your iPhone's Reminders App Even Better with 10 New Features
 How To:
See Passwords for Wi-Fi Networks You've Connected Your Android Device To
How To:
See Passwords for Wi-Fi Networks You've Connected Your Android Device To
 How To:
Use FaceTime's Secret Hand Gestures and Reaction Buttons to Add Animated On-Screen Effects to Your Video Feed
How To:
Use FaceTime's Secret Hand Gestures and Reaction Buttons to Add Animated On-Screen Effects to Your Video Feed
 How To:
16 Harry Potter Spells for Siri That Turn Your iPhone into a Magical Elder Wand
How To:
16 Harry Potter Spells for Siri That Turn Your iPhone into a Magical Elder Wand
 How To:
Dox Anyone
How To:
Get RCS Messaging in Your iPhone's Messages App for iMessage-Like Chats with Android Users
How To:
Dox Anyone
How To:
Get RCS Messaging in Your iPhone's Messages App for iMessage-Like Chats with Android Users
 How To:
Find the Most Accurate Weather Source for Your Area (And See Which Apps Use It)
How To:
Find the Most Accurate Weather Source for Your Area (And See Which Apps Use It)
 How To:
Create a Hidden Piston Door in Minecraft
How To:
Create a Hidden Piston Door in Minecraft
 How To:
Dial These Secret Codes to See if Someone Is Hijacking Calls & Texts on Your iPhone
How To:
Dial These Secret Codes to See if Someone Is Hijacking Calls & Texts on Your iPhone
 How To:
Make Spoofed Calls Using Any Phone Number You Want Right from Your Smartphone
How To:
Make Spoofed Calls Using Any Phone Number You Want Right from Your Smartphone
 How To:
13 Tips Every Apple Pencil User Needs to Know for iPad
How To:
13 Tips Every Apple Pencil User Needs to Know for iPad
 How To:
Crack Shadow Hashes After Getting Root on a Linux System
How To:
Crack Shadow Hashes After Getting Root on a Linux System
 How to Hack Wi-Fi:
Get Anyone's Wi-Fi Password Without Cracking Using Wifiphisher
How to Hack Wi-Fi:
Get Anyone's Wi-Fi Password Without Cracking Using Wifiphisher
 How To:
Disable the iMessage Typing Bubble Indicator So Others Don't Know You're Currently Active in the Chat
How To:
Disable the iMessage Typing Bubble Indicator So Others Don't Know You're Currently Active in the Chat
 How To:
Compute a square root using the geometric method
How To:
Compute a square root using the geometric method
 How To:
Clone Any Android App on Your Samsung Galaxy Phone Without Using Any Third-Party Tools
How To:
Clone Any Android App on Your Samsung Galaxy Phone Without Using Any Third-Party Tools
 How To:
CC in a Physical Business Letter
How To:
Download and Install iOS 18 Beta or iPadOS 18 Beta to Try New iPhone or iPad Features First
How To:
CC in a Physical Business Letter
How To:
Download and Install iOS 18 Beta or iPadOS 18 Beta to Try New iPhone or iPad Features First
 How To:
Keep Your Night Vision Sharp with the iPhone's Hidden Red Screen
How To:
Keep Your Night Vision Sharp with the iPhone's Hidden Red Screen
 How To:
If 'Messages' Consumes Too Much iPhone or iCloud Storage, Don't Delete Your Conversations Just Yet
How To:
If 'Messages' Consumes Too Much iPhone or iCloud Storage, Don't Delete Your Conversations Just Yet
 How To:
19 Harry Potter Spells Your Android Phone Can Cast Using Google Assistant
How To:
19 Harry Potter Spells Your Android Phone Can Cast Using Google Assistant
 How To:
Fold an Origami F-18 Fighter Jet Out of a Dollar Bill
How To:
Fold an Origami F-18 Fighter Jet Out of a Dollar Bill
 How To:
Create a Basic Attendance Sheet in Excel
How To:
Create a Basic Attendance Sheet in Excel
 How To:
Find Passwords in Exposed Log Files with Google Dorks
How To:
Find Passwords in Exposed Log Files with Google Dorks
 How To:
The First 10 Things to Do After Rooting Your Phone
How To:
The First 10 Things to Do After Rooting Your Phone
 How To:
See Who's Viewed Your TikTok Profile (And How to Stop Them from Knowing You Visited Theirs)
How To:
See Who's Viewed Your TikTok Profile (And How to Stop Them from Knowing You Visited Theirs)
 How To:
Manually Switch to a Different LTE Band on Any Samsung Galaxy Phone
How To:
Manually Switch to a Different LTE Band on Any Samsung Galaxy Phone
 How To:
Download & Watch the Original Star Wars Trilogy Unaltered
How To:
Download & Watch the Original Star Wars Trilogy Unaltered
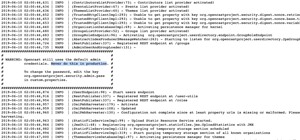
 Hacking Windows 10:
How to Create an Undetectable Payload, Part 1 (Bypassing Antivirus Software)
Hacking Windows 10:
How to Create an Undetectable Payload, Part 1 (Bypassing Antivirus Software)
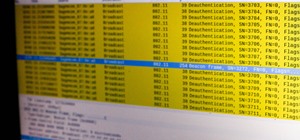 How To:
Detect Script-Kiddie Wi-Fi Jamming with Wireshark
How To:
Detect Script-Kiddie Wi-Fi Jamming with Wireshark
 How To:
Make Anonymous Calls from Your iPhone
How To:
Make Anonymous Calls from Your iPhone
 How To:
Apple's Reminders App Has the Ultimate Solution for Managing Grocery Lists on Your iPhone
How To:
Apple's Reminders App Has the Ultimate Solution for Managing Grocery Lists on Your iPhone
 How To:
Your iPhone Has Hidden Tools to Help You Understand Emoji Better
How To:
Your iPhone Has Hidden Tools to Help You Understand Emoji Better
 Scrabble Challenge #10:
Would You Play a Phoney Word to Win?
Scrabble Challenge #10:
Would You Play a Phoney Word to Win?
 News:
The 5 Best Free Email Apps for Your iPhone
News:
The 5 Best Free Email Apps for Your iPhone
 How To:
Record Your iPad or iPhone's Screen (No Jailbreak or Computer Required)
How To:
Record Your iPad or iPhone's Screen (No Jailbreak or Computer Required)
 How To:
Create an Admin User Account Using CMD Prompt (Windows)
How To:
Create an Admin User Account Using CMD Prompt (Windows)