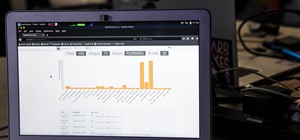
In this tutorial, we learn how to make a histogram chart in Excel. To create a vertical histogram, you will enter in data to the chart. Then, highlight all of the data and go to "insert", "chart", then choose a regular column chart. Grab a regular 2D column and then make sure ...more
hether you're interested in learning Microsoft Excel from the bottom up or just looking to pick up a few tips and tricks, you've come to the right place. In this tutorial from everyone's favorite digital spreadsheet guru, ExcelIsFun, the 21st installment in his "Highline Excel ...more
New to Microsoft Excel? Looking for a tip? How about a tip so mind-blowingly useful as to qualify as a magic trick? You're in luck. In this MS Excel tutorial from ExcelIsFun, the 199th installment in their series of digital spreadsheet magic tricks, you'll learn how to apply c ...more
New to Microsoft Excel? Looking for a tip? How about a tip so mind-blowingly useful as to qualify as a magic trick? You're in luck. In this MS Excel tutorial from ExcelIsFun, the 638th installment in their series of digital spreadsheet magic tricks, you'll learn how to add two ...more
Whether you're interested in learning Microsoft Excel from the bottom up or just looking to pick up a few tips and tricks, you've come to the right place. In this tutorial from everyone's favorite digital spreadsheet guru, ExcelIsFun, the 31st installment in his "Highline Exce ...more
Here is how to make a histogram-like display in Excel 2008 for OSX. Note that you have to right click on the actual bars in the graph to get the menu to come up. If you work on a Mac and need to use Excel 2008 to make histograms, then watch this MS Office tutorial.
A histogram is a summary graph showing a count of data points that fall in various ranges. Histograms are used in statistics and other forms of mathematics. In this video, learn how to create your own histogram using data analysis on the computer. This tutorial will show you h ...more
New to Microsoft Excel? Looking for a tip? How about a tip so mind-blowingly useful as to qualify as a magic trick? You're in luck. In this MS Excel tutorial from ExcelIsFun and Mr. Excel, the 5th installment in their joint series of digital spreadsheet magic tricks, you'll le ...more
If you use Microsoft Excel on a regular basis, odds are you work with numbers. Put those numbers to work. Statistical analysis allows you to find patterns, trends and probabilities within your data. In this MS Excel tutorial from everyone's favorite Excel guru, YouTube's Excel ...more
If you use Microsoft Excel on a regular basis, odds are you work with numbers. Put those numbers to work. Statistical analysis allows you to find patterns, trends and probabilities within your data. In this MS Excel tutorial from everyone's favorite Excel guru, YouTube's Excel ...more
Microsoft excel is a powerful tool used to work with numbers and data by filling them down in rows and columns of a table. Excels also supports macros, which are small scripts to automate certain functions. In Microsoft Excel you can select entire rows and columns using the ra ...more
Many seasoned users of Microsoft Excel, who have been using spreadsheets for years, still scroll through their spreadsheets, laboriously, with the horizontal and vertical scrollbars. In this software tutorial, you'll learn how to navigate around in Excel both quickly and effic ...more
Ever wonder what those bars and lines on the LCD screen on your digital camera do? In this great tutorial, Ethan Wilding demonstrates how to read one of the most useful features on your camera: the histogram. The histogram is a graph which represents the distribution of light ...more
New to Microsoft Excel? Looking for a tip? How about a tip so mind-blowingly useful as to qualify as a magic trick? You're in luck. In this MS Excel tutorial from ExcelIsFun, the 636th installment in their series of digital spreadsheet magic tricks, you'll learn how to create ...more
Description Of Excel Magic Trick 444-> to understand this you can also download it from EMT 440-451. There are some numbers listed in vertical and horizontal form. and now suppose we want to multiply them. In order to multiply them we will highlight the cells of the next ve ...more
This video tutorial is in the software category where you will learn how to remove tabs and scroll bars from an Excel spreadsheet. Open a work sheet and you will find scroll bar on the right and at the bottom. But, why should you take them off? If you are making a user form th ...more
In this Software video tutorial you will learn how to use the filter & sort feature in Excel. First create a column chart on an excel sheet. In this example, it is a date and sales chart. Click alt+F1 and the chart is displayed. Then click and delete the legend and the horizon ...more
This video is a tutorial on how to remove scroll bars, sheet tabs and objects in Excel. To remove scroll bars and sheet tabs, go to the Office button, then Excel Options. On the screen that comes up go to the Advanced tab and scroll down to “Display options for this workbook”, ...more
If you use Microsoft Excel on a regular basis, odds are you work with numbers. Put those numbers to work. Statistical analysis allows you to find patterns, trends and probabilities within your data. In this MS Excel tutorial from everyone's favorite Excel guru, YouTube's Excel ...more
New to Microsoft Excel? Looking for a tip? How about a tip so mind-blowingly useful as to qualify as a magic trick? You're in luck. In this MS Excel tutorial from ExcelIsFun and Mr. Excel, the 627th installment in their joint series of digital spreadsheet magic tricks, you'll ...more
In this Software video tutorial you will learn how to make a basic bar graph in Microsoft Excel. You will also learn how to give your chart a title and how to label the axes. First you put in all your data in to an Excel spreadsheet. Then you highlight the data you want to put ...more
Whether you're interested in learning Microsoft Excel from the bottom up or just looking to pick up a few tips and tricks, you're in the right place. In this tutorial from everyone's favorite digital spreadsheet guru, ExcelIsFun, the 42nd installment in his "Highline Excel Cla ...more
In excel a left click is made on box A1 and the X title is typed in as year. In A2 the year 2001 is typed and in A3 the year 2002. Both A2 and 3 boxes are highlighted and the bottom right hand corner is used to drag the work into a copied sequence down to A12. In B1 "populatio ...more
If you want to create a Pareto Chart for categorical data in MS Excel you should first have your data input into Excel already. From your data, you should highlight the cells that you want to count the frequency for and in the frequency box you should type in =COUNTIF and high ...more
Welcome to the first chapter of Excel is Simple, a place where we will burst all myths around excel and try to make it simpler and fun to use. I would like to share an important tip…if you want to be fast with Excel, try to avoid using the mouse as much as you can. We will so ...more
While iPhone cameras these days are downright impressive, the same can't be said for the Camera app. In true Apple form, Camera is as simple as possible, forcing you to go third-party for pro-level features. With iOS 14, however, Apple adds a little extra professionalism, allo ...more
It's common knowledge these days that Apple puts great cameras into their iPhones. So, it probably comes as no surprise to learn that the iPhone 12, 12 mini, 12 Pro, and 12 Pro Max sport some excellent shooters. What you might not know, however, is that these cameras are quite ...more
As I've mentioned in recent days, it was refreshing to discover that Microsoft's HoloLens 2 stage production was every bit as accurate as presented (check out my hands-on test of the device for more on that). But beyond watching Microsoft's deft HoloLens 2 stagecraft, and try ...more
Stories are everywhere in social media today, but that wasn't always the case. In 2013, Snapchat introduced the world to these temporary windows into our daily lives. Since then, stories have infiltrated other popular apps. However, to stand out, you can't solely rely on the a ...more
If you have a modern iPhone, you have an excellent video recorder at your disposal. Every iPhone since the 6S has the ability to shoot in 4K resolution, and each new iteration has brought new capabilities to the table. But even the best mobile shooter can use a little extra he ...more


