In this Software video tutorial you will learn how to make a basic bar graph in Microsoft Excel. You will also learn how to give your chart a title and how to label the axes. First you put in all your data in to an Excel spreadsheet. Then you highlight the data you want to put ...more
There are times when you need to make a super-quick pie chart (such as to insert in a blog post or quick printout) but find that doing it in Excel or OpenOffice takes a bit more effort than you’d like. Is there a faster way for quick’n'dirty pie charts? Yes. You can use Create ...more
Learn intarsia knitting using a graph in this five part video tutotial series. When knitting intarsia, blocks of color are worked with separate balls or bobbins of yarn, producing a sweater only one layer thick. Get the free simple heart chart used in these videos, here. Part ...more
In this tutorial, we learn how to make your first graph in Microsoft Excel. First, open a new graph and enter in your data. Click and drag down from the original date you enter to have the other dates automatically entered in. Enter the rest of your information, then highlight ...more
It's finally out. After months of testing, iOS 13 is available to install on your iPhone, which means over 200+ new features you can use right now. The update, released on Sept. 19, can be installed over the air or from a restore image using iTunes in macOS Mojave and older or ...more
When it comes to graphing and comparing functions, the TI-83 graphing calculator is the end-all device for math and science students. But one of the most entertaining aspects of Texas Instruments' powerful algebraic and trigonometric calculator is not the equations themselves, ...more
There are over 1.6 million apps on the Google Play Store, which makes it the largest collection of mobile apps on the planet. However, a large portion of this total is occupied by apps with overlapping functions—think social media, news, weather, music players, and various oth ...more
The new Samsung Galaxy S4 has something no other phone has ever had before—weather sensors. Older devices like the Galaxy Nexus, S3, Note, and Note 2 do have a atmospheric pressure sensor, aka a barometer. However, they do not have a thermometer or hygrometer like the GS4 does ...more
With Sprint already rolling out their Jelly Bean updates to Samsung Galaxy S III owners here in the United States, international users have already had a chance to check out Android's newest OS on their S3, but all is not gravy. It seems that folks have been noticing an incre ...more
There are a lot of apps in Google Play for your Samsung Galaxy Note 2 that let you create, edit, and view Microsoft Office files on the go, but none match up to the power of an app called Polaris Office for Samsung Galaxy devices. However, the newest version, Polaris Office 5 ...more
This video shows how to find the formula of a piecewise function when given a graph. The first step is to write a definition for the graph, which is done by identifying the different domains shown in the graph. The second step is writing formulas for each domain specified by t ...more
One of Microsoft Excel's capabilities is to allow you to graph Normal Distribution, or the probability density function, for your busines. This is a quick and easy tracking feature you can learn in just a few minutes.
The majority of Android devices have built-in sensors underneath the hood that measure motion, position, and several environmental parameters that provide data needed to monitor your movements and adjust accordingly. When the Samsung Galaxy S4 came out, they included for the ...more
Getting a new phone is exciting, but having access to its exclusive apps ahead of its release is what we're all about here on Gadget Hacks. If you have a Galaxy Note 3, you've probably only had it for a year or less, so upgrading to the Note 4 may not be a viable option when ...more
If I were a math major, I'd probably be rolling in dough somewhere in Silicon Valley right now, but since multiplying numbers and figuring out tangents gives me panic attacks, I went the English route... pays much better. Still, I never would have graduated if I didn't pass a ...more
It would only make sense that Google is one of the most active app developers on the Android platform, particularly when you consider that they develop the platform itself. From my count, there are an astounding 117 unique apps that the search giant and its subsidiaries have p ...more
Oops... did you forget to connect to a Wi-Fi network before streaming HBO GO on your iPhone? While those episodes of The Wire may have been absolutely life-changing, your three-digit cellular bill is definitely going to hit you a little harder. Managing data usage is a consta ...more
Figuring out exactly which apps on your phone are eating through resources and battery life can be a difficult task. Though some information can be found in Android's battery menu, the charts and graphs provided here pale in comparison to what's offered by the GSam app. If you ...more
Contrary to popular belief, augmented reality apps have been available for a while now. I remember using the Layar app (still available for iOS and Android) to explore nearby businesses and landmarks with varying success via an early-generation Android handset. It would be ha ...more
Checking the weather ranks among the most mundane but essential tasks you can do on your smartphone. Thankfully, both the iOS App Store and Google Play are loaded with weather apps that add some much needed spice to this daily routine, giving you less of a reason to be caught ...more
I have a personal rule when it comes to an app's interface: If it doesn't follow Android's design guidelines, it was probably written with Apple's iOS in mind first and foremost. And if that truly is the case, I almost take this as a personal insult. I'm not a second-class ci ...more
Step 1: What Exploit Development Is and Why Should I Be Interested on About This Topic An exploit is a piece of software, a chunk of data, or a sequence of commands that takes advantage of a bug or vulnerability in order to cause unintended or unanticipated behavior to occur ...more
Ever watched Netflix on your phone only to realize an hour later that you forgot to turn Wi-Fi on? That's a whole lot of data used. If you've ever gone over your allotted mobile data limit, you know firsthand how costly your carrier's overage fees can truly be. From that poin ...more
Defcon is the largest hacker conference with something for everyone, whether it be the talks, parties, villages, or any of the hundreds of events. In this guide, we'll take a holistic view at everything that goes into attending the con for the first time, from securing your el ...more
So you finally decided to make the switch from iOS to Android, huh? Well first off: welcome to the world of tomorrow. And secondly: good call, mate. In all seriousness, switching between mobile ecosystems can be quite the hassle. Even after you've grown accustomed to the new ...more
For the majority of my math classes in middle and high school, a graphing calculator was a must. While the calculators were very useful to have, they were quite steep in the price column. After losing the TI-83 graphing calculator my parents bought me in high school, I had to ...more
These days, there are Android apps for every budget—forgive me if that sounds like a car commercial, but that's just the way things are in the age of the smartphone and tablet. You've got apps that require monthly subscriptions, paid apps that will run you a $30 one-time insta ...more
Anyone who uses a computer on a regular basis probably knows how to access the task manager to check system resources and usage stats. However, on a Samsung Galaxy S3 or other Android device, it may not be so obvious. There's no equivalent to Control-Alt-Delete, but it's still ...more
WikiLeaks. In recent weeks, it's been the hottest topic on the web. It's been attacked on a multinational level by political influence peddling. First, U.S. Senator Joe Lieberman swayed Amazon's decision to stop hosting WikiLeaks. Then, Tableau Software removed graphs from th ...more
In this video the teacher shows us how to use a TI-84 plus graphing calculator to graph a function, adjust the view window, and determine the values of several types of critical points on the graph such as x-intercept, y-intercept, local maximums, and local minimums. After ent ...more
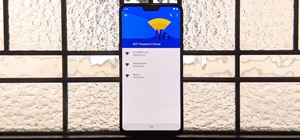
What if you could easily visualize which access point every Wi-Fi device nearby is connected to in a matter of seconds? While programs like Airodump-ng can intercept this wireless information, making it easy for hackers to use and understand is another challenge. Fortunately, ...more
Texas Instruments is one of the best known companies for creating graphing calculators. In this video tutorial you will see how to use a little known feature that lets you create pretty elaborate drawings on it. This is a great time-waster in math class! Who needs algebra or g ...more
By combining years of web search advancements, natural language processing, and even DeepMind's artificial intelligence, Google Assistant hopes to change the way you interact with your devices. If you're familiar with Google's previous services, Google Assistant is like Google ...more
If you've ever wanted to track down the source of a Wi-Fi transmission, doing so can be relatively easy with the right equipment. Using a directional Wi-Fi antenna and Wireshark, we can create a display filter to target any device in range to plot the signal strength on a gra ...more
With iOS 12, Apple is making up for mistakes from the past, with iPhone batteries being no exception. The new update builds upon both battery health and performance throttling tools introduced in iOS 11.3 by offering users more information about your iPhone's battery usage tha ...more
Let's say you're flush with Google Opinion Rewards credits, or you just got a Google Play gift card for your birthday. This is a perfect opportunity to remove ads and unlock new features by upgrading some of your free apps to their paid counterparts, or to finally purchase tha ...more
Your iPhone's Weather app received its biggest update yet. Apple finally incorporated its Dark Sky purchase into Apple Weather, so you'll see more information for each location's forecast. Plus, there are a few surprises to be excited about, such as the ability to add more tra ...more
Need a little help with your math homework? No problem, the Math Centre offers students video tutorials that will provide as a reference guide for self-study. Students get self-study resources targeted to the needs of individual courses, and teachers gain generic mathematics s ...more
Task Manager got revamped quite a bit in modern versions of Windows. First introduced in Windows NT 4.0, it's become pretty popular among more advanced users. In Windows 10, Task Manager is not just a task manager anymore, it's also a system monitor, startup manager, history v ...more
YouTube user NotesCollegeAlgebra teaches you how to evaluate combinations of functions from graphs. You start off with a graph and some functions. (f+g)(-3), (g/f)(0) and (fg)(-6). You start looking at the graph and the first line and you get (f+g)(-3)=f(-3)+g(-3)=3+1=4. (g/f) ...more
Need to know how to use your Texas Instruments graphing calculator for your college math or statistics class? You're in luck... watch this video tutorial to see how to use ANOVA with a TI-83 graphing calculator. What is ANOVA? One-way Analysis of Variance. Researchers at Purd ...more
Need to know how to use your Texas Instruments graphing calculator for your college math or statistics class? You're in luck... watch this video tutorial to see how to do binomial probabilities with a TI-83 graphing calculator. Binomial probabilities. A pack of M&M's contain ...more
If you're a PC gamer, you know the value of performance metrics. These graphs and charts overlaid on top of a game give you real-time information about how well your system performs. And for the first time, Galaxy users running One UI 3.0 will get access to similar information ...more
If you are given an equation of ellipse in the form of a function whose value is a square root, you may need to simplify it to make it look like the equation of an ellipse. Now equate the function to a variable y and perform squaring on both sides to remove the radical. Now si ...more
Your iPhone tracks how many steps you take, how far you walk, and how many stairs you climb each day. That may seem a bit frightening, but it's all for a good reason: the Health app stores this data so you can view your progress in one place. But interestingly, opening the Hea ...more
Flight disruptions can cost billions of dollars, but most modern commercial flights rely on air traffic control systems that harbor serious vulnerabilities. The Federal Aviation Administration uses an infrastructure called NextGen, which relies on Automatic Dependent Surveilla ...more
In this video tutorial, viewers learn how to graph a linear equation in 3 different ways. The first way is to use the table of values. It is the slowest method but it always work. It is the most useful. The second way is to use the slope-intercept. It is more faster than the t ...more
I remember how fast my Nexus 7 was the first time I turned it on. Boy, do I miss it. Now my tablet is pretty buggy and crashes happen frequently, and I'm sure that goes for many of your Nexus 7s as well. Even if you upgrade to the new Nexus 7 next week, it will eventually deve ...more
Struggling to find and calculate the correct consumer surplus for an econ class or in any other situation? Take a look at this guide that will walk you through the different equations and graphs necesssary to understand and calculate consumer surplus.
Notes College Algebra teaches you how to find the equation of an ellipse given a graph. You first want to find out the center of the ellipse, which in the video is (2, -3). The major axis is parallel to the X axis. The equation is (x - h) squared/a squared plus (y - k) squared ...more
In this video the author shows how to graph using an X-Y table. He shows how to do this with a sample equation. He builds a table of x, y values where he takes sample values for x like -1, 0, 1 and now he substitutes these values in the equation of the line and obtains the cor ...more
Amazingly enough, some of us still have to worry about exceeding our monthly mobile data limits. You'd figure carriers would have given the customers what they want by now by offering truly unlimited plans, but with two conglomerates sitting atop the U.S. cellular market with ...more
Need to know how to use your Texas Instruments graphing calculator for your college math or statistics class? You're in luck... watch this video tutorial to see how to perform a chi-square test on a TI-83 graphing calculator. The table on page 30 of your TI Workbook list the ...more
The video shows the explanation of greatest integer function. This video explains this with the help of graphs. The video first describes the basic greatest integer function. This means the greatest integer less than or equal to the number gave. The graph of this function is d ...more
Need a little help with your math homework? No problem, the Math Centre offers students video tutorials that will provide as a reference guide for self-study. Students get self-study resources targeted to the needs of individual courses, and teachers gain generic mathematics s ...more
Smartphones have been a hot button issue around school campuses for several years now—some schools allow them, others confiscate them on sight. But the fact of the matter is, when used correctly, a smartphone can be just as much of a learning tool as a textbook or school-issue ...more
What is a Data Structure? When we think of a "structure" we often think of architecture, but data also often has structure. There are many different types of data structures: arrays, graphs, queues, stacks, and so on. We use these structures in order to be able to effectively ...more
This video is an instructional guide about Graph Linear Equations presented in algebraic form. It is an easy to follow, step by step guide to solving such equations using the graph intercept formula. The first example equation is Y = 2x -1 over y = mx + b. The video then shows ...more
Need a little help with your math homework? No problem, the Math Centre offers students video tutorials that will provide as a reference guide for self-study. Students get self-study resources targeted to the needs of individual courses, and teachers gain generic mathematics s ...more
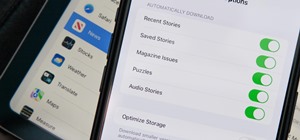
One feature in iOS you're likely underutilizing is 3D Touch, a highly useful, unique tool for iPhones ever since it first appeared on the iPhone 6S. Apple's pressure-sensitive interactivity gives iOS an extra layer of functionality, which can be clearly seen across the entiret ...more